CaliVibe: Interactive map of California counties and cities — population, crime rates, temperature, and 3D terrain
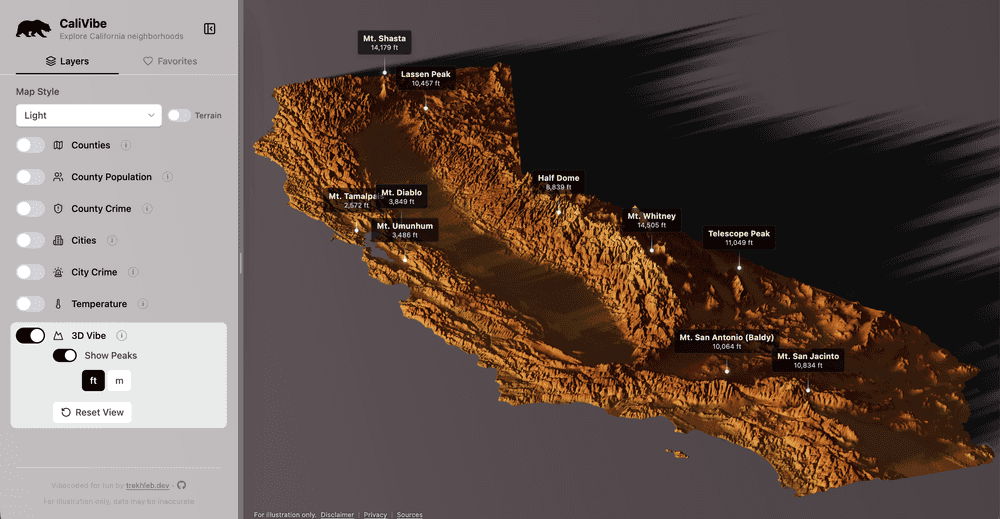
Sometimes it is easier to understand a place through data rather than descriptions.
So I built a small interactive app that lets you explore California counties and cities using different metrics like:
- population
- crime rates
- temperature trends
- topographical landscape
- and other geographic data
You can try it here:
The project is also open-sourced:
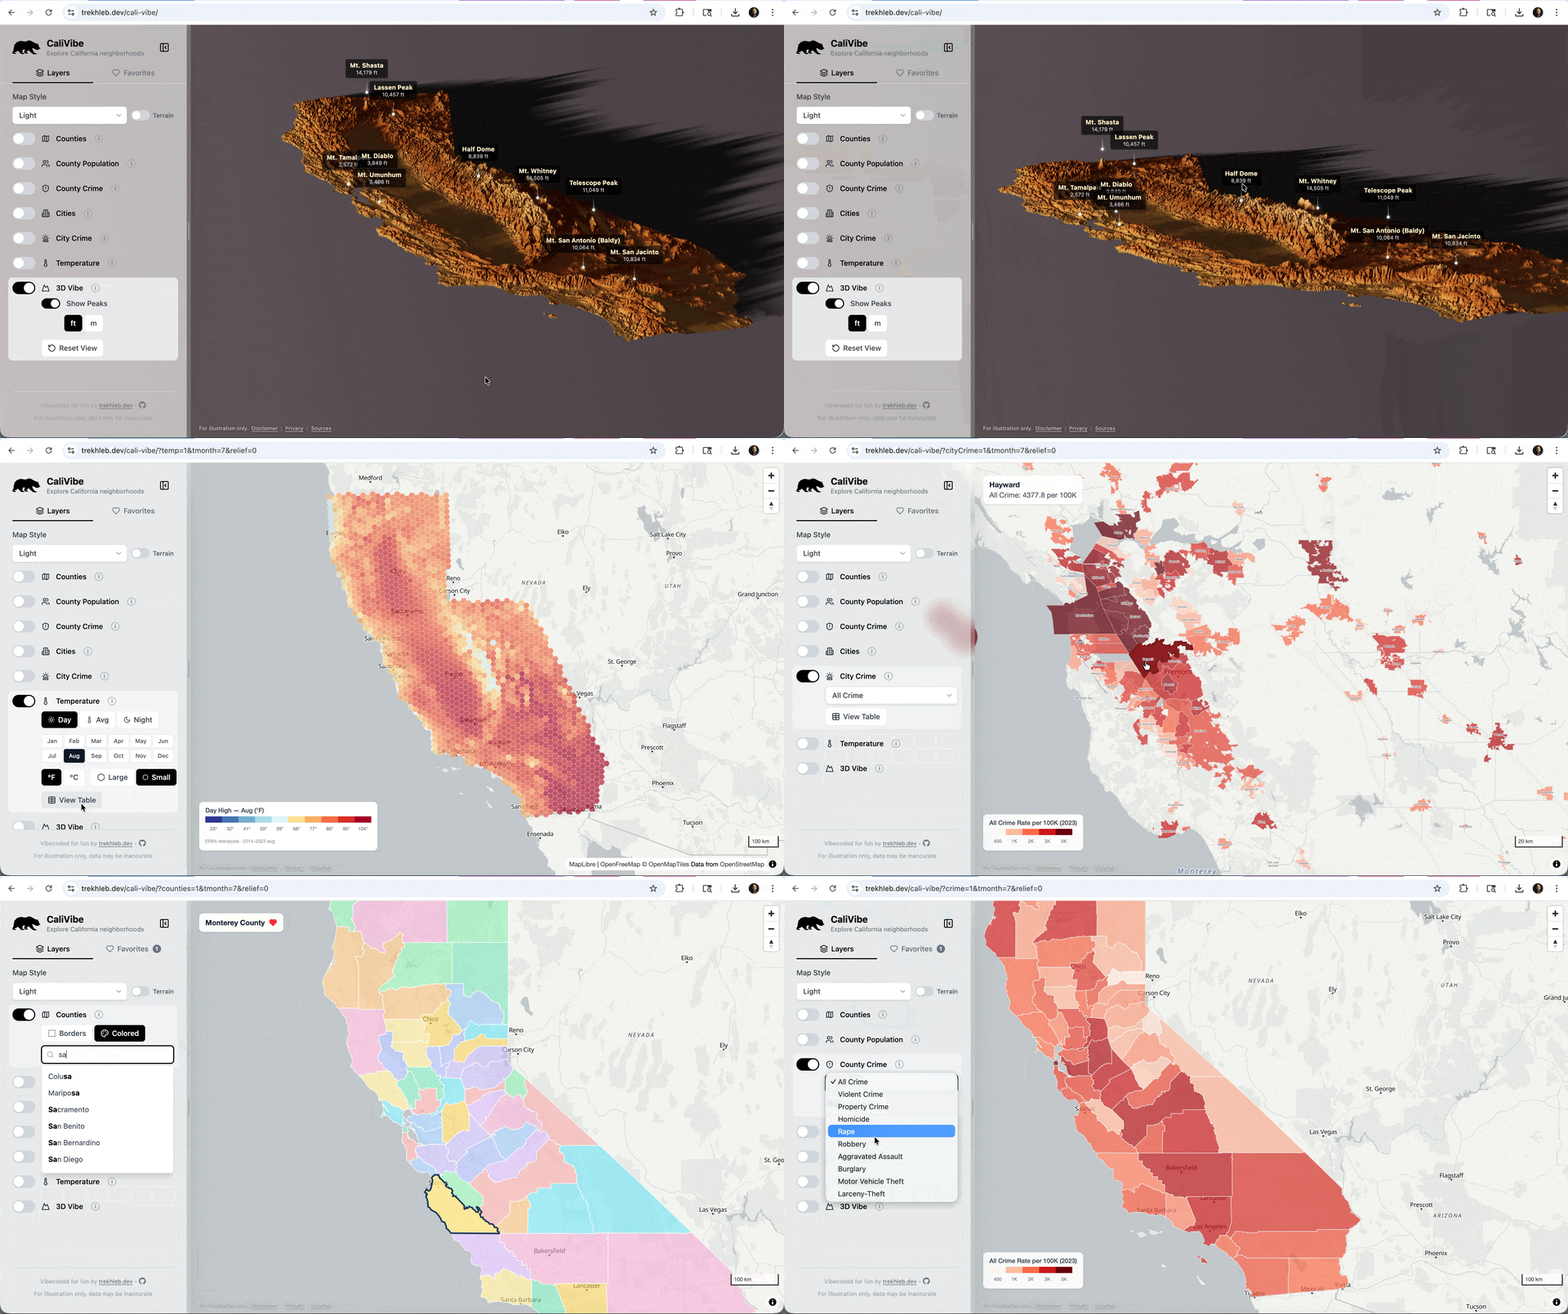
Here is a quick demo of the main data layers that are currently available:
What you can explore
The app lets you quickly switch between different datasets and see how regions compare.
For example, you can explore:
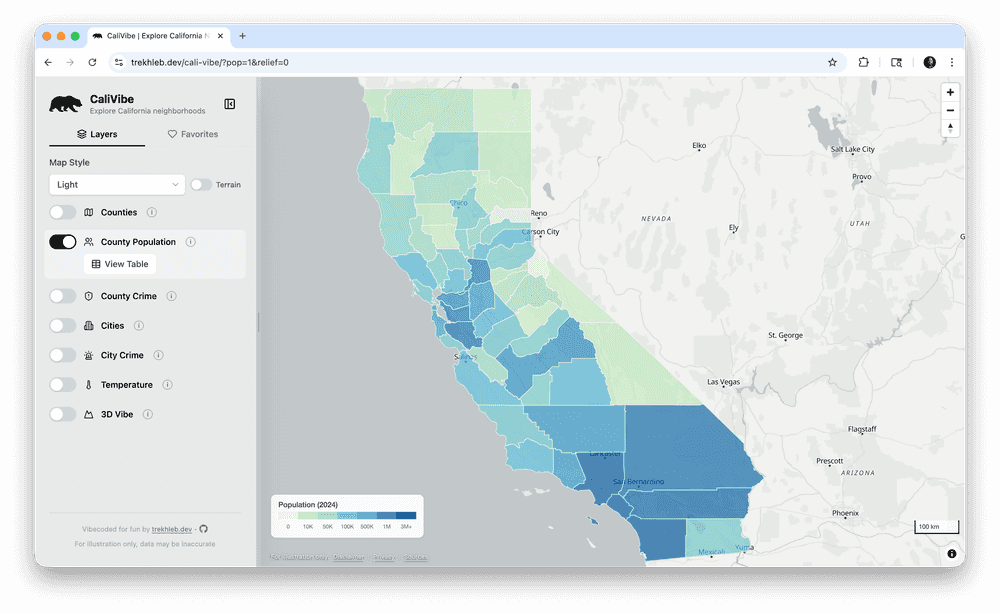
- Population distribution
- Crime statistics
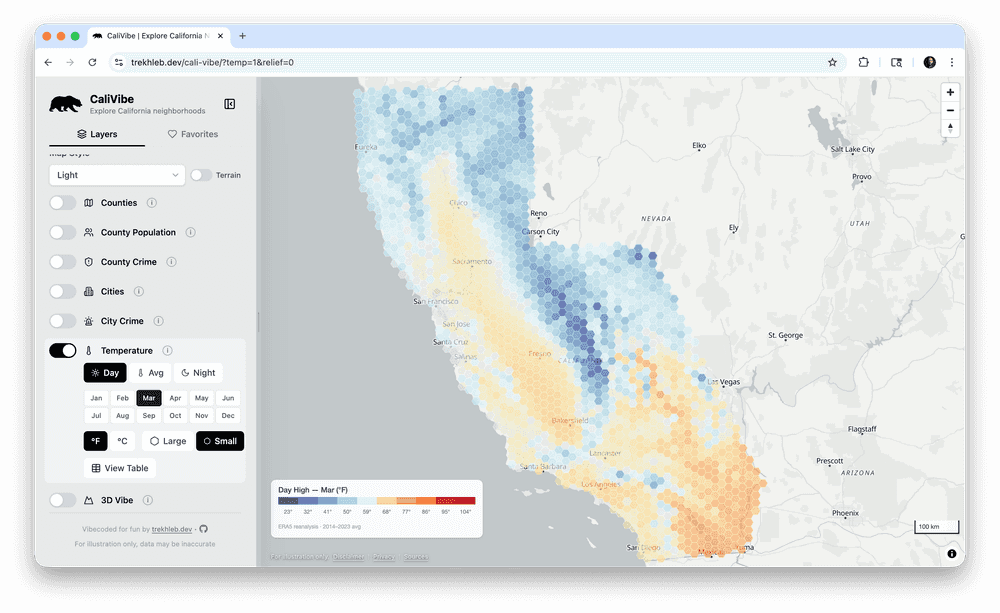
- Temperature trends
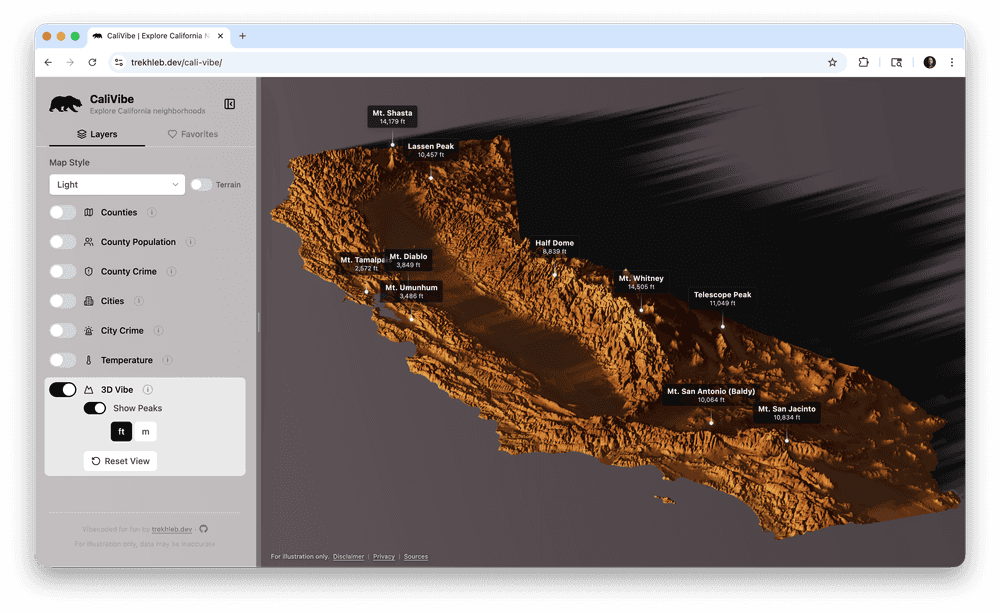
- Terrain elevation
Each dataset can reveal interesting patterns across California counties and cities.
Example views
Terrain view
Temperature trends
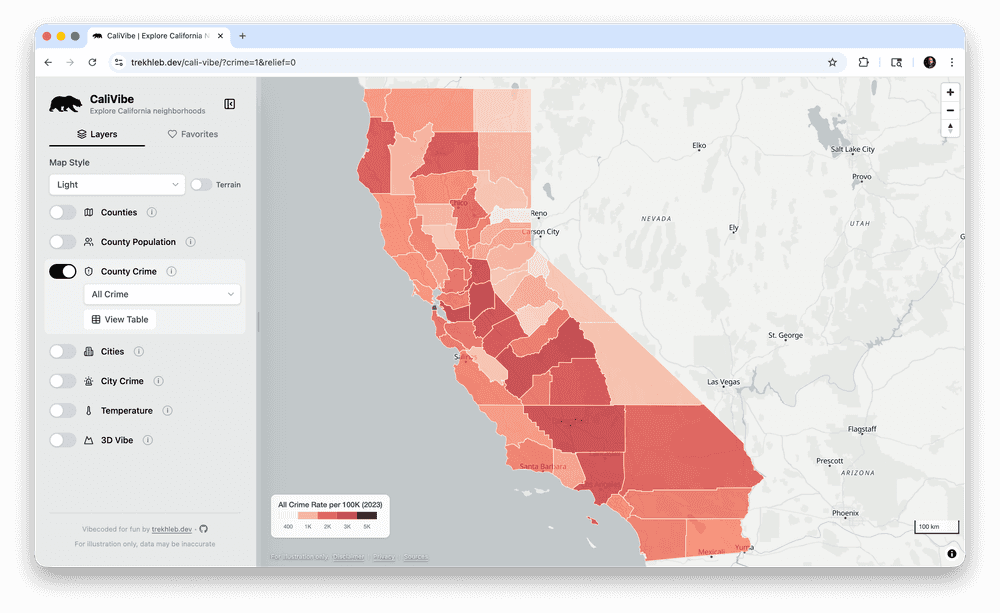
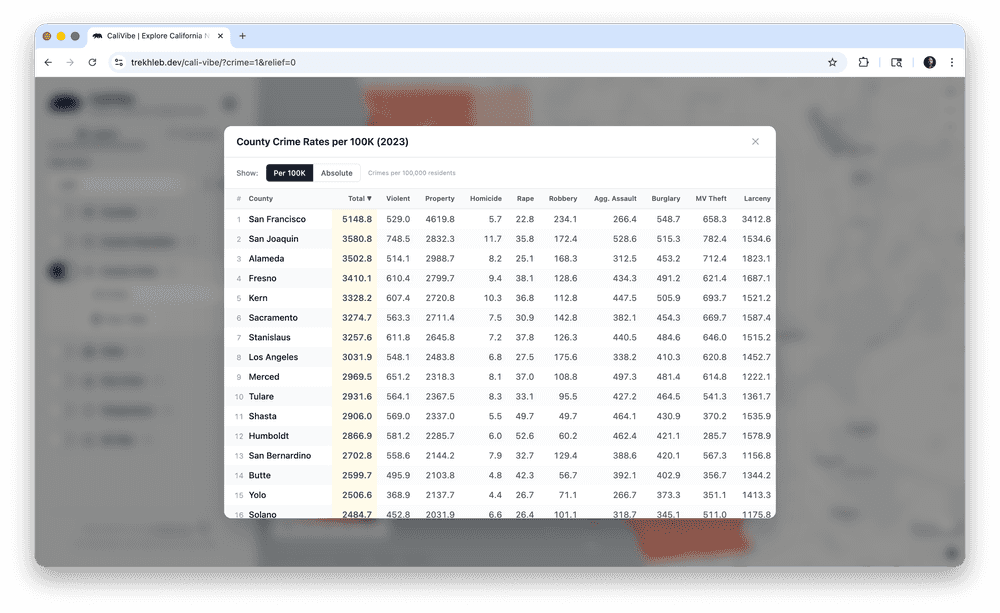
Crime rates per city/county
County population
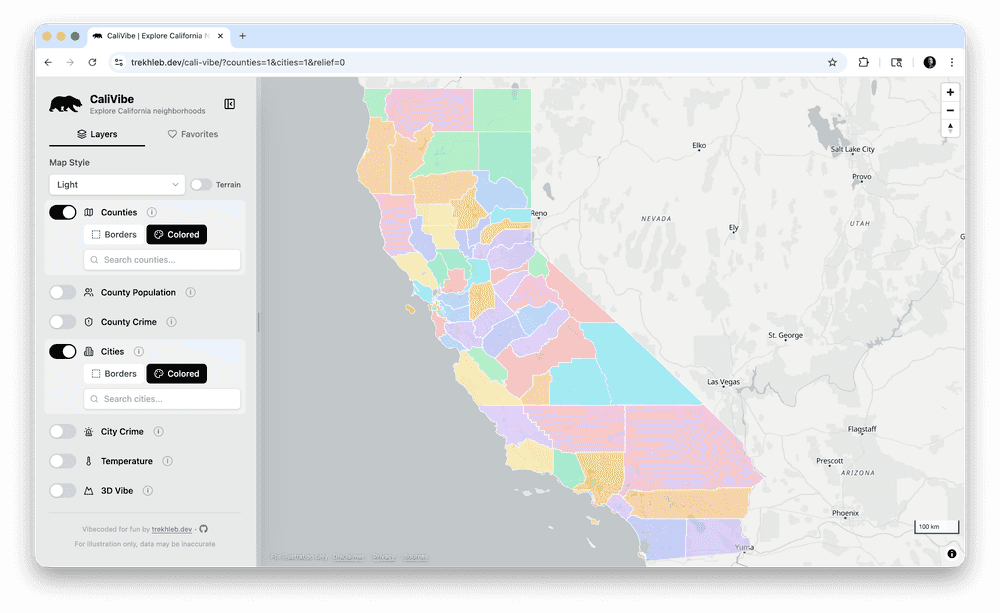
County/city borders
Tech stack
The app is intentionally simple and fully client-side.
Frontend
- React
- TypeScript
- Vite
- Tailwind CSS
Visualization
- MapLibre GL
- Three.js
Data
- JSON datasets are loaded as static assets.
Data sources
Some of the data used in the project comes from:
- CA DOJ OpenJustice
- California Department of Finance
- US Census Bureau
- Open-Meteo climate datasets
- Terrain tiles from AWS
The processed datasets are included in the repository.
Development experiment
Another interesting aspect of this project is that it was mostly AI-assisted development.
I vibe-coded for fun: ~98% of the code was written by Claude Code Opus with a few sprinkles from Gemini 3.1 Pro.
This made it possible to move from idea → working prototype very quickly.
Why I built this
I enjoy building small interactive tools that help explore data visually.
Sometimes a map + a few sliders can reveal patterns much faster than tables or reports.
This project was mostly a weekend experiment, but it turned into a fun way to explore California through data.
Source code
If you're curious how it works internally:
👉 https://github.com/trekhleb/cali-vibe
Feedback, ideas, and improvements are welcome.
